合 IO追踪神器blktrace使用介绍
👉 本文共约2401个字,系统预计阅读时间或需10分钟。
目录
- 前言
- blktrace安装
- blktrace的原理
- 一个I/O请求进入block layer之后,可能会经历下面的过程:
- blkparse显示的各指标点示意:
- blktrace 能够记录下IO所经历的各个步骤:
- blktrace的用法
- 实时查看:
- 先采集,再查看:
- blktrace产生的文件太零散怎么办?
- 生成采集文件
- 合并成一个二进制文件
- 其实我们还是嫌弃blkparse的输出太多,不方便查看,此时可以利用btt协助分析统计
- 上述命令其实还会产生一些.dat文件,可以看到iops信息
- 文件解释:
- 修改blkparse的输出格式:
- 一次IO的生命周期:direct read 附录见测试代码
- 一次IO的生命周期:direct write 附录见测试代码
- blktrace -a 参数可以指定监控的动作:
- 其他工具:blkiomon
- 参考
前言
- blktrace的作者正是block io的maintainer,开发此工具,可以更好的追踪IO的过程。
- blktrace 结合btt可以统计一个IO是在调度队列停留的时间长,还是在硬件上消耗的时间长,利用这个工具可以协助分析和优化问题。
blktrace安装
1 2 3 4 | yum install -y blktrace blkiomon -- 或 git clone git://git.kernel.dk/blktrace.git |
blktrace的原理
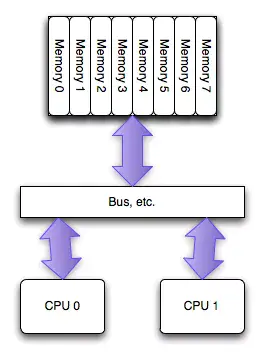
一个I/O请求的处理过程,可以梳理为这样一张简单的图:

一个I/O请求进入block layer之后,可能会经历下面的过程:
- I/O enters block layer – it can be:
- Remapped onto another device (MD, DM)
- Split into 2 separate I/Os (alignment, size, ...)
- Added to the request queue
- Merged with a previous entry on the queue All I/Os end up on a request queue at some point
- At some later time, the I/O is issued to a device driver, and submitted to a device
- Later, the I/O is completed by the device, and its driver
blkparse显示的各指标点示意:
1 2 3 4 5 6 | Q------->G------------>I--------->M------------------->D----------------------------->C |-Q time-|-Insert time-| |--------- merge time ------------|-merge with other IO| |----------------scheduler time time-------------------|---driver,adapter,storagetime--| |----------------------- await time in iostat output ----------------------------------| |
其中:
- Q2Q — time between requests sent to the block layer
- Q2G — time from a block I/O is queued to the time it gets a request allocated for it
- G2I — time from a request is allocated to the time it is Inserted into the device's queue
- Q2M — time from a block I/O is queued to the time it gets merged with an existing request
- I2D — time from a request is inserted into the device's queue to the time it is actually issued to the device
- M2D — time from a block I/O is merged with an exiting request until the request is issued to the device
- D2C — service time of the request by the device
- Q2C — total time spent in the block layer for a request
blktrace 能够记录下IO所经历的各个步骤:

blktrace的输出:

- 第一个字段:8,0 这个字段是设备号 major device ID和minor device ID。
- 第二个字段:3 表示CPU
- 第三个字段:11 序列号
- 第四个字段:0.009507758 Time Stamp是时间偏移
- 第五个字段:PID 本次IO对应的进程ID
- 第六个字段:Event,这个字段非常重要,反映了IO进行到了那一步
- 第七个字段:R表示 Read, W是Write,D表示block,B表示Barrier Operation
- 第八个字段:223490+56,表示的是起始block number 和 number of blocks,即我们常说的Offset 和 Size
- 第九个字段: 进程名
其中第六个字段非常有用:每一个字母都代表了IO请求所经历的某个阶段。
1 2 3 4 5 6 7 8 9 | Q – 即将生成IO请求 | G – IO请求生成 | I – IO请求进入IO Scheduler队列 | D – IO请求进入driver | C – IO请求执行完毕 |
blktrace的用法
实际上blktrace仅仅是用来采集数据,数据的分析其实有很多辅助的工具,比如:
本人提供Oracle(OCP、OCM)、MySQL(OCP)、PostgreSQL(PGCA、PGCE、PGCM)等数据库的培训和考证业务,私聊QQ646634621或微信db_bao,谢谢!